
How to Increase Hotel Occupancy in Dubai: The 2026 GCC Demand Recovery Playbook
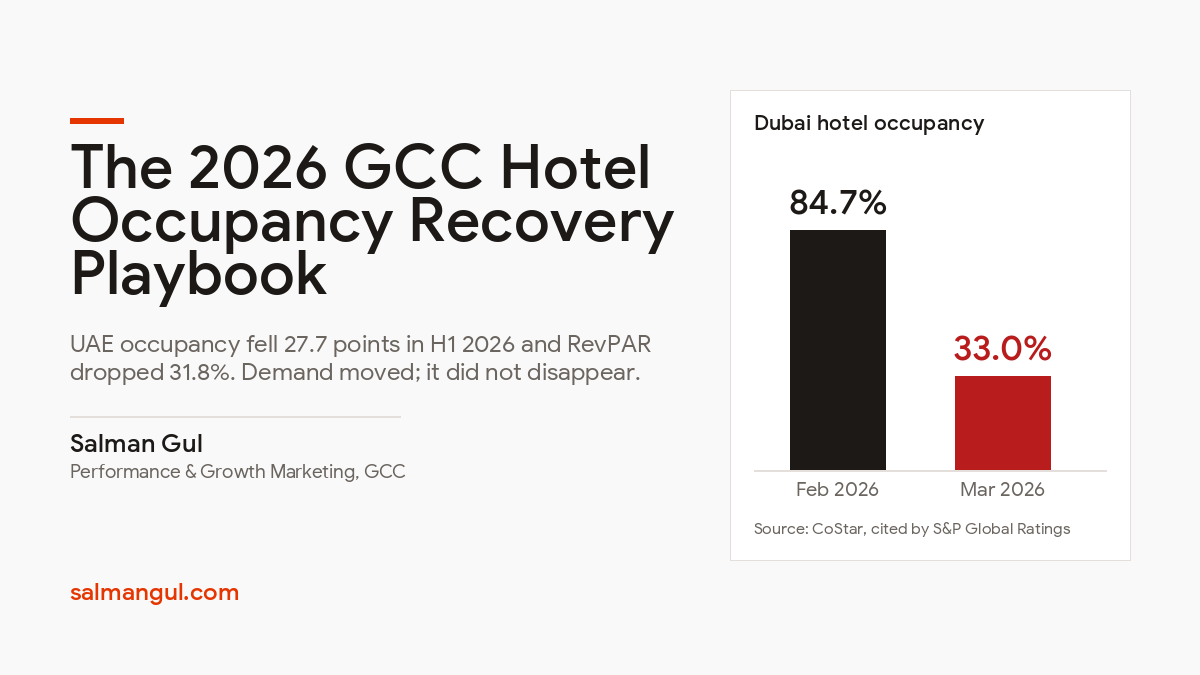
In February 2026, Dubai’s hotels were running at 84.7% occupancy. Four weeks later, that number was roughly 33%.
That is not a seasonal dip. That is a market-wide demand event, and if you run marketing for a hotel, resort or hospitality group anywhere in the GCC, you have spent the last four months trying to answer one question in board meetings: what do we actually do about it?
Most of the advice circulating right now is worthless. It is either a global listicle written by someone who has never sold a room night in this region, or a vendor pitch dressed up as strategy, or a news report that describes the problem in detail and then stops exactly where the useful part should begin.
This article is the useful part.
I have spent over a decade running performance marketing, ecommerce and demand generation across the UAE, Saudi Arabia, Bahrain and the wider GCC, including hospitality and lead generation work in the UAE, and travel-sector growth for an eSIM platform selling to inbound and outbound travellers across the region. I have watched what happens to acquisition costs when regional demand contracts, and I have watched which hotels come out of it with a stronger P&L than they went in with.
They are almost never the ones who cut rate hardest. They are the ones who changed where their demand came from and what it cost to acquire.
Below is the full playbook: the real numbers, the frameworks, the channel-level execution, the arithmetic that makes the business case, and the mistakes I would tell any client to avoid.
-27.7percentage point fall in UAE hotel occupancy, H1 2026
-31.8%UAE RevPAR, year on year through June
33%Dubai occupancy in March, down from 84.7% in February
+4.7%Makkah RevPAR growth over the same period
78%of Saudi Q1 2026 arrivals were domestic travellers
This is one of two deep-dive playbooks behind Digital Marketing for Hotels in the GCC: The Complete Guide.
1. What Actually Happened to GCC Hotel Demand in 2026
Let us start with facts, not sentiment.
According to CBRE’s H1 2026 analysis, built on CoStar hotel performance data, UAE hotel occupancy fell by 27.7 percentage points year on year through June 2026, and revenue per available room dropped 31.8%. Dubai recorded the sharpest decline of any emirate. Abu Dhabi held up comparatively well, cushioned by stronger domestic demand and an events-led calendar.
The month-level data is even starker. CoStar figures cited by S&P Global Ratings show Dubai occupancy falling from 84.7% in February 2026 to approximately 33% in March 2026, with UAE-wide occupancy at 36.2% over the same period, and that was with aggressive discounting and domestic demand support already in place.
The knock-on effects were immediate and structural:
- Roughly 5,400 Dubai hotel rooms were pulled out of the market in April 2026, as operators temporarily closed properties or accelerated planned refurbishments rather than trade at those levels. S&P expects that inventory to return gradually through late 2026 and 2027.
- Dubai International handled 18.6 million passengers in Q1 2026, down 20.6% year on year, with cargo volumes down 22.7% on regional airspace disruption.
- The GCC economy is forecast to contract by roughly 3% in 2026, even though the UAE (+1.5%), Saudi Arabia (+2.6%) and Oman (+1.6%) are still expected to post positive growth individually.
The recovery timeline you should be planning against
S&P Global Ratings expects hotel occupancy to begin improving from Q4 2026, but does not expect a return to pre-conflict levels before the end of 2027. IHG’s managing director for India, Middle East and Africa, Haitham Mattar, has said the group’s Q4 2026 forward booking pace is already ramping up, led by GCC domestic travellers and Indian visitors.
Meanwhile, the leading indicators have already turned:
- GCC passenger volumes rose 66.2% between April and May 2026 (DragonPass)
- Airlines were scheduled to operate roughly 22.9 million departing seats from and within the Middle East in July 2026 (OAG)
- WTTC’s leadership has publicly noted that Middle East tourism has historically recovered from security-related shocks in as little as two months when governments and industry act together
Read that combination carefully, because it defines your entire strategy. Airlift is returning faster than confidence. Seats are coming back before travellers are. That means the constraint in Q3–Q4 2026 is not access to your destination: it is demand generation and conversion. Which is a marketing problem, not an operations problem.
2. The Data Nobody Is Reading Properly: Demand Moved, It Did Not Disappear
Here is where almost every hotel marketing plan I have reviewed this year gets it wrong.
The headline number: “occupancy down 27.7 points”: gets treated as if all demand evaporated uniformly. It did not. Demand redistributed, and it redistributed in a highly predictable pattern that tells you exactly where to point your budget.
Saudi Arabia is the proof
Look at what happened across the border:
| Saudi market (Q1/H1 2026) | Metric | Direction |
|---|---|---|
| Madinah | 82% occupancy: highest in Kingdom | Resilient |
| Makkah | 59.8% occupancy; ADR SAR 775; RevPAR +4.7% YoY | Growing |
| Jeddah | 59.2% occupancy | Stable, domestic-led |
| Riyadh (incl. Diriyah) | 55.7% Q1; 49.3% Jan–Apr, down 17.9%; RevPAR −18.3% | Sharply down |
| National average (Jan–Apr) | 63.4% occupancy; ADR SAR 754; RevPAR SAR 478 | Mixed |
Sources: Saudi Ministry of Tourism Q1 2026 performance report; Knight Frank Saudi Hospitality & Religious Tourism Report, June 2026; GASTAT.
Now put those two rows side by side. Makkah grew RevPAR by 4.7% in the exact quarter Riyadh lost 18.3%. Same country. Same conflict. Same headlines. Opposite outcomes.
The difference is not marketing skill. It is demand composition. Makkah’s demand is purpose-driven and non-discretionary: 1.71 million pilgrims performed Hajj in 2026, up 2.2% year on year. Riyadh’s incremental demand is international business and discretionary leisure, which is the single most confidence-sensitive category in travel.
Domestic demand did the heavy lifting
The Saudi data makes this unambiguous. In Q1 2026, approximately 28.9 million domestic trips were recorded: around 78% of total tourist arrivals, with domestic tourism spend reaching roughly SAR 34.7 billion, up 8% year on year. Ultra-luxury Red Sea resorts hit 82% occupancy during the final ten days of Ramadan, driven almost entirely by Saudi families choosing home-market luxury over international travel. This is the same structural story behind Saudi Arabia’s broader economic emergence.
In the UAE, the same mechanic explains why Abu Dhabi outperformed Dubai: stronger domestic demand and a protected events calendar. And IHG has confirmed the third piece: the conflict shifted regional demand rather than destroying it, with Egypt and Saudi Arabia emerging as beneficiaries.
When international discretionary demand contracts, the hotels that hold RevPAR are the ones with a pre-built ability to sell to domestic, regional and purpose-driven guests: through channels they own.
Most GCC hotels do not have that ability, because they spent the last five years buying international discretionary demand through OTAs and never built the direct, first-party, domestic-facing engine that would let them pivot in ninety days.
That is the actual problem. The occupancy number is just the symptom.
3. The Four Demand Pools Framework
This is the framework I use with hospitality clients to force a portfolio view of demand instead of a single blended occupancy number. Every GCC hotel sells into distinct pools. They behave completely differently under stress.
| Demand pool | Booking window | Shock sensitivity | Dominant channel | Acquisition cost | H1 2026 behaviour |
|---|---|---|---|---|---|
| 1. International long-haul discretionary (UK, Europe, Russia, China, US) | 30–60 days | Very high | OTA + metasearch | Highest (18–30%) | Collapsed first, recovers last |
| 2. Intra-GCC regional (Saudi, Kuwaiti, Qatari, Omani residents) | 7–21 days | Low–Medium | Direct, social, WhatsApp, referral | Medium (8–15%) | Held up; drove Abu Dhabi outperformance |
| 3. Domestic resident / staycation | 0–10 days | Very low | Email, social, resident offers, direct | Lowest (2–6%) | Grew; carried Saudi Q1 |
| 4. Purpose-driven (religious, medical, education, contracted MICE) | 30–90 days | Low for religious/medical; high for MICE | Direct, agent, corporate | Low–Medium (4–12%) | Makkah/Madinah grew; MICE fell |
| 5. Near-haul emerging (India, Pakistan, CIS, East Africa) | 14–30 days | Medium | OTA, metasearch, social | Medium (12–20%) | Recovering first alongside airlift |
How to use it
Run this exercise this week. Pull your last 24 months of reservations and tag every booking to a pool. Then, for each pool, record: share of room nights, share of room revenue, the change between 2025 and H1 2026, blended acquisition cost, and contribution margin.
Nine times out of ten, the output is the same uncomfortable finding: Pool 1 is 55–70% of your room nights, it costs the most to acquire, it has the worst retention, and it is the pool that just evaporated. Meanwhile Pools 2, 3 and 4 (the resilient ones) are underdeveloped because nobody ever built dedicated acquisition infrastructure for them.
Your 2026 objective is not “get occupancy back.” It is rebalance the portfolio so the next shock costs you 10 points instead of 50.
4. The Three Mistakes Most GCC Hotels Made in Q2 2026
I have reviewed enough account structures and media plans this year to say these three failures were near-universal.
Mistake 1: Cutting marketing spend before cutting rate discipline
The reflex when occupancy falls is to protect EBITDA by cutting the most visible discretionary line: marketing. This is precisely backwards during a confidence-driven demand shock.
Here is why, in one line of arithmetic. Marketing spend is largely fixed cost spread across available rooms. At 85% occupancy, a monthly AED 300,000 budget across a 200-room hotel is roughly AED 58 per room night sold. At 35% occupancy, the same budget is AED 141 per room night sold. Cutting the budget in half does not fix that ratio: it just removes the only lever that changes the numerator.
The correct move is not “spend less.” It is “spend the same or more, on entirely different demand pools, with a lower cost per acquired booking.”
Mistake 2: Discounting rate to solve a confidence problem
Rate cuts work when the barrier is price. They do almost nothing when the barrier is perceived safety or uncertainty. A traveller who is unsure whether they should fly to the region does not become sure because the room is 30% cheaper. You have simply given away ADR to the guests who were coming anyway.
| Response | What it fixes | What it costs | When to use |
|---|---|---|---|
| Rate discount | Price objection | Permanent ADR erosion; rate-parity contamination across OTAs; slow recovery of rate integrity | Only when you have a genuine price-competitiveness gap vs comp set |
| Value-add packaging (credits, F&B, transfers, flexible cancellation) | Perceived risk + value perception | Marginal COGS only; protects headline ADR | Default response in a confidence shock |
| Demand-pool shift (target resilient pools) | Actual demand shortfall | Media investment + operational readiness | Highest-return response; do this first |
Notice which properties in the region used which. The DET-partnered offers running through 2026 lean heavily on resort credits equivalent to 100% of room rate, complimentary nights and attraction tickets: value-add structures, not headline rate cuts. That is not an accident.
Mistake 3: Treating it as a revenue-management problem instead of a marketing problem
Revenue management optimises the yield on demand that already exists. It cannot manufacture demand that is not there. In a shock, the RM system dutifully lowers rate to chase a demand curve that has shifted left, and the marketing team, which is the only function that can move the curve, gets its budget cut.
If your occupancy recovery plan is being run out of the revenue office rather than jointly with marketing, you are optimising a shrinking pie.
5. The Channel Economics Problem That Was Already There
Here is the part that turns a crisis into an opportunity. The demand shock did not create your channel cost problem. It exposed one that has been quietly compounding for years, and it created the political capital to finally fix it.
The real cost of every channel in 2026
| Channel | Cost as % of booking value | Notes |
|---|---|---|
| Direct: organic / brand search | 2–5% | Cheapest revenue in hospitality |
| Direct: email / CRM to past guests | 2–4% | Cheapest incremental revenue |
| Direct: loyalty rebooking | 3–5% | Compounds with database size |
| Direct: retargeting on first-party data | 8–12% | |
| Direct: metasearch (Google Hotel Ads, Trivago, Kayak) | 8–14% | The commission-arbitrage sweet spot |
| Direct: paid search (non-brand) | 10–18% | Varies by market and comp set |
| OTA: standard programme | 15–22% commission → 25–35% true cost | True cost includes upsell commission, higher cancellation rates, tech fees, VAT. I break the full stack down in how to reduce OTA commission treatment |
| OTA: preferred / visibility programme | 20–28% commission → 30–42% true cost | Visibility boosts stack on top of base rate |
Sources: 2026 hotel distribution benchmarks; Booking.com typical rates around 15% (range 10–25% by market and tier); Expedia Group typically 18–22%.
The arithmetic that wins the boardroom
Take a 200-room Dubai upper-upscale property. Assume a realistic recovery scenario: ADR AED 550, occupancy 60%. That is 43,800 room nights and AED 24.09 million in annual room revenue. Baseline channel mix: OTA 55%, Direct 20%, Corporate/GDS 15%, Wholesale/Groups 10%, at an effective OTA cost of 20%.
Now shift 15 percentage points of revenue from OTA to direct (OTA 55% → 40%, direct 20% → 35%):
| Line | Calculation | Result |
|---|---|---|
| Revenue shifted | AED 24.09m × 15% | AED 3,613,500 |
| Old cost on that revenue (OTA @ 20%) | 3,613,500 × 0.20 | AED 722,700 |
| New cost on that revenue (blended direct @ 8%) | 3,613,500 × 0.08 | AED 289,080 |
| Net annual saving | 722,700 − 289,080 | AED 433,620 |
AED 433,620 per year, from one property, with zero additional room nights sold. That is roughly the fully loaded annual cost of a three-person in-house digital team: funded entirely by commission arbitrage.
The metric that reframes everything: Net RevPAR
Standard RevPAR is dangerously incomplete because it ignores what the revenue cost to acquire. Use this instead:
Net RevPAR = (Room Revenue − Total Distribution & Acquisition Cost) ÷ Available Room Nights
| Scenario | ADR | Occ | RevPAR | Blended acquisition cost | Net RevPAR |
|---|---|---|---|---|---|
| Current | AED 550 | 60% | AED 330 | 20% | AED 264.00 |
| After channel shift | AED 550 | 60% | AED 330 | 13% | AED 287.10 |
That is an 8.7% improvement in Net RevPAR without acquiring a single additional guest.
Stop and consider what that means in a market where S&P does not expect a return to pre-conflict occupancy until the end of 2027. You cannot control when international confidence returns. You can absolutely control what your demand costs you. Channel mix is the only RevPAR lever that is fully within your control in a down market, and it is the one almost nobody is pulling.
6. The 90-Day GCC Hotel Occupancy Recovery Playbook
This is the sequence I would run for any UAE or Saudi property starting today. It is built around a specific assumption: Q4 2026 is when demand starts returning, so the acquisition infrastructure has to be finished before it does. Building a direct engine while demand is recovering means you capture the recovery on OTA terms (at 25–35% true cost) and lose the single best window you will get this decade.
Phase 1, Days 0–30: Diagnose and reallocate
| Action | Owner | Output |
|---|---|---|
| Tag 24 months of reservations to the demand pools | Revenue + Marketing | Demand portfolio table |
| Calculate true cost per channel including cancellations, upsell commission, tech fees, VAT | Finance + Commercial | Channel P&L |
| Calculate current Net RevPAR and set a target | Commercial | Board-level KPI |
| Audit brand-term search: who is bidding on your hotel name? | Marketing | Brand defence gap report |
| Audit booking engine: mobile load speed, steps to book, payment methods (Apple Pay, Tabby/Tamara, mada, Benefit), Arabic UX | Marketing + IT | CRO backlog |
| Export and clean the guest database; assess consent status | CRM | Addressable first-party audience size |
| Verify Google Business Profile and Google Hotel Center free booking links are live and rate-accurate | Marketing | Zero-cost direct channel activated |
Do not launch new campaigns in Phase 1. You will be pouring media into a funnel that leaks.
Phase 2, Days 31–60: Capture the pools that still exist
Point budget at Pools 2, 3 and 4 (the resilient ones) while Pool 1 is still soft.
- Domestic / resident (Pool 3): UAE and Saudi resident-targeted staycation offers, geo-fenced to the emirate or city, with resident-verification mechanics. Nationality-language creative (Arabic, English, Hindi/Urdu, Tagalog, Russian) matched to your actual resident mix, not a generic English campaign.
- Intra-GCC regional (Pool 2): Saudi, Kuwaiti and Qatari family travel targeting around school holidays and long weekends. Short booking windows (7–21 days) mean always-on, not burst campaigns. WhatsApp Business as a conversion channel, not an afterthought: it is the dominant messaging channel in this region and converts far above email for GCC nationals.
- Purpose-driven (Pool 4): Medical tourism, education, religious travel corridors, and re-contracting soft MICE. This is where Makkah’s +4.7% RevPAR came from.
- Near-haul emerging (Pool 5): India first. It is the fastest-recovering inbound source and IHG has explicitly flagged Indian visitors as a Q4 booking-pace driver. Airlift is already restored.
Phase 3, Days 61–90: Build the direct engine
| Priority | Initiative | Target metric |
|---|---|---|
| 1 | Brand-term defence on Google Ads + Google Hotel Ads | Brand impression share > 90% |
| 2 | Metasearch activation (Google Hotel Ads, Trivago, Kayak) on commission-per-stay | Direct CPA 8–14% |
| 3 | Booking engine CRO sprint | Conversion 2.2% → 3.5%+ |
| 4 | Lifecycle email/SMS/WhatsApp automation for past guests | CRM revenue > 10% of direct |
| 5 | Member-rate structure (best rate on brand.com only) | Direct share +10 pts |
| 6 | Arabic + English SEO for city, neighbourhood and intent clusters | Organic direct sessions +40% |
Phase 4, Q4 2026 onward: Position for the curve
Budget against forward booking pace, not last year’s actuals. In a recovery, last year is a meaningless comparator. Set weekly pickup targets by pool and by booking window, and shift media budget toward whichever window is under-pacing.
Re-engage MICE early. It has the longest lead time (30–90 days plus contracting), it is the most confidence-sensitive segment, and it is the one Dubai and Abu Dhabi lead regionally. Whoever gets back into the RFP flow first wins 2027.
7. Channel-by-Channel Execution Guide
Google Ads
Brand defence first. OTAs bid on your hotel name. If you are not defending, you are paying commission on guests who typed your brand into Google with the explicit intent of booking you directly. This is the single highest-ROI spend in hotel marketing and it is routinely underfunded.
Google Hotel Ads. Google Hotel Ads and free booking links now account for an estimated 32–35% of global hotel metasearch traffic, up from roughly 22% in 2023. Free booking links cost nothing but a live, accurate rate feed. If you have not activated them, you are declining free direct revenue.
Performance Max, with guardrails. Useful for prospecting, dangerous unsupervised. Exclude brand terms into a separate exact-match campaign so PMax cannot claim credit for demand you already own.
Demand Gen. Genuinely effective for domestic and GCC-regional prospecting on YouTube and Discover, where travel inspiration happens.
Meta
Meta remains the highest-volume channel for Pools 2 and 3. Structure around resident lookalikes built from your actual first-party guest database rather than interest targeting, Advantage+ campaigns feeding the booking engine with a proper Conversions API implementation, and retargeting segmented by funnel depth (viewed rooms / started booking / abandoned). Given short booking windows in this market, keep attribution tight: 7-day click / 1-day view is more honest than the default.
TikTok
Underused by GCC hotels and disproportionately effective for Saudi and UAE domestic audiences under 35. Spark Ads on genuine creator content outperform polished brand films by a wide margin. Track through a dedicated landing page, not blended attribution.
Metasearch
The commission-arbitrage engine. At 8–14% cost per booking versus 25–35% true OTA cost, every booking you win on metasearch instead of an OTA click-through is 11–27 points of retained revenue. Run on commission-per-stay where available so you pay on realised revenue rather than clicks.
SEO: including the part everyone skips
Hotel SEO in the GCC is a two-language problem. English captures inbound international and expat resident demand; Arabic captures Saudi, Kuwaiti and Qatari family travel: the resilient pool. Most UAE hotel sites have either no Arabic version or a machine-translated one that ranks for nothing.
Priority clusters: [hotel type] in [city] and [hotel type] in [neighbourhood]; things to do near [landmark]; [event/season] hotel deals [city]; the Arabic equivalents of all of the above; and direct-booking intent terms such as best rate guarantee, official site and book direct. If you want a sense of how destination-intent content performs in this market, look at how much traffic sits behind queries like free things to do in Dubai.
Email, SMS and WhatsApp
At 2–4% acquisition cost, CRM is the cheapest incremental revenue in hospitality, and direct bookers are worth roughly 60% more over their lifetime than OTA-acquired guests. The constraint is almost never tooling. It is that the guest database was never captured properly at check-in, or was captured and never consented.
Fix capture at the property level: front desk, Wi-Fi login, F&B, spa, in-room. Every touchpoint is a first-party data opportunity that reduces next year’s acquisition cost.
Booking engine CRO
| Benchmark | Rate |
|---|---|
| Average hotel website conversion rate (2026) | 2.2%–3.9% |
| High-performing boutique properties | 5%+ |
| Unoptimised properties | as low as 0.73% |
| OTA conversion rates (for context) | 12%–15% |
OTAs convert at 12–15% because visitors arrive ready to buy: that is context, not a target. But the spread between 0.73% and 4.72% among hotel sites is a 6.5x difference that single-handedly determines whether direct or OTA is cheaper for your property.
GCC-specific CRO priorities most properties get wrong:
- Payment methods: Apple Pay, Tabby and Tamara (UAE/Saudi BNPL), mada (Saudi), Benefit (Bahrain). Card-only checkout leaks Saudi domestic conversions badly.
- Arabic RTL layout that actually works, not a flipped stylesheet
- Mobile load speed: the majority of GCC travel research is mobile-first
- Fewer steps. Every additional screen between rate display and confirmation costs conversion
- Trust signals at the rate widget: best-rate guarantee, free cancellation, review score
8. How to Ride the Government Demand Wave
GCC tourism authorities are spending heavily to rebuild demand. Most hotels participate passively: they get listed, and that is the extent of it. That is money left on the table.
Dubai’s ‘A Dubai Invite’ programme, launched by the Department of Economy and Tourism, runs from 20 July to 31 October 2026. It rewards UAE residents who nominate overseas friends and family with benefit packages worth over AED 3,000 (roughly US$816), including up to 45% off hotel stays and resort credits equivalent to 100% of room rate at participating properties. Residents can nominate up to five visitors at a time, receive up to three reward packages, must register by 30 September, and arrivals are verified automatically through GDRFA Dubai. Benefits are redeemable until 31 December 2026. Dubai Summer Surprises 2026 ran 2 July to 30 August alongside it.
This is a government-funded demand-generation campaign aimed squarely at Pools 2 and 3: exactly the resilient pools. Here is how to actually exploit it rather than just appear in it:
- Build a dedicated landing page for the programme with your specific offer. Do not send traffic to your generic homepage.
- Run paid support against it. The destination authority is generating awareness; you should be capturing the intent it creates. Bid on the programme name and related terms.
- Target your own resident guest database. These are people who already know your property and now have a financial incentive to bring guests to it. This is the cheapest campaign you will run all year.
- Capture the visitor, not just the resident. The nominated guest is a new first-party record and a future direct booker. Get their consent.
- Build the upsell. A discounted room with a resort credit is a break-even room. The F&B, spa and attraction attach rate is where it becomes profitable.
Apply the same logic to Saudi Tourism Authority campaigns, Riyadh Season, AlUla season programming, Abu Dhabi’s events calendar, and Qatar’s event-led inbound pushes. The same mechanic works for retail and leisure operators too: it is the logic behind effective shopping mall marketing in Dubai. Destination marketing creates intent. Your job is to convert it before an OTA does.
9. Measurement: The KPIs That Matter in a Downturn
Most hotel marketing dashboards in this region are measuring the wrong things, and the wrong things look worst in exactly the moment you most need clarity.
| Stop reporting | Start reporting | Why |
|---|---|---|
| Occupancy alone | Net RevPAR | Occupancy bought at 35% acquisition cost is not a win |
| Blended ROAS | Cost per net direct booking, by pool | Blended ROAS hides brand-term cannibalisation |
| Website sessions | Booking engine conversion rate | Traffic without conversion is a leak, not an asset |
| Total bookings | Channel contribution margin | Reveals which channels actually make money |
| YoY comparisons | Forward booking pace vs pickup target | Last year is meaningless after a demand shock |
| Email list size | Consented, addressable, active records | An unconsented database is a liability, not an asset |
| Social followers | First-party records acquired per month | Followers are rented; data is owned |
The two formulas to put on the board deck
Net RevPAR = (Room Revenue − Distribution & Acquisition Cost) ÷ Available Room Nights
Direct Shift Value = (Revenue Shifted to Direct) × (OTA Effective Cost % − Direct Blended Cost %)
The second one is how you get marketing budget approved in a year when every other line is being cut. It converts a marketing initiative into a cost-saving programme with a defined return: which is a conversation the CFO will actually engage with.
A note on attribution and booking windows
Booking windows have compressed. Where travellers once booked 30–45 days out, the 2026 norm is 15–25 days, with last-minute bookings (0–6 days) now representing roughly 30–35% of all reservations. This has two consequences most media plans have not adjusted for. First, always-on beats burst: a campaign that runs for two weeks a month misses half the decision windows. Second, long attribution windows overstate paid social, with a 15–25 day booking window, a 28-day view-through window will claim credit for bookings it did not influence.
10. Real-World Examples From the 2026 Market
Example 1: Makkah, the purpose-driven portfolio
Makkah delivered ADR of SAR 775 and RevPAR growth of 4.7% year on year in the same period Riyadh lost 18.3%. The Kingdom welcomed 1.71 million Hajj pilgrims in 2026, up 2.2%, and 218,000 hotel rooms, branded residences and serviced apartments are planned across Makkah and Madinah developments.
The transferable lesson: non-discretionary demand is shock-proof. Every hotel has some purpose-driven demand available to it: medical, education, government, contracted corporate, religious, family events. Most treat it as incidental. It should be a deliberately built portfolio line.
Example 2: Abu Dhabi, events as demand insurance
Abu Dhabi outperformed Dubai through the H1 2026 shock on stronger domestic demand and an events-led calendar. Events create dated, non-substitutable demand: if the event is on the 14th, the guest cannot shift to next quarter or a different country.
The transferable lesson: a hotel’s event calendar is a demand-generation asset, not a banqueting revenue line. Build packages around the destination’s fixed calendar six months out.
Example 3: Red Sea Global, domestic luxury capture
Ultra-luxury Red Sea resorts hit 82% occupancy during the final ten days of Ramadan, driven by Saudi families choosing home-market luxury while international travel felt uncertain. Q1 2026 domestic tourism spend in the Kingdom reached roughly SAR 34.7 billion, up 8% year on year, across approximately 28.9 million domestic trips: about 78% of total arrivals.
The transferable lesson: the domestic guest is not a discount guest. Positioned correctly, domestic luxury demand pays full rate and books directly.
Example 4: IHG, reading the pace, not the headlines
While headlines focused on the Dubai decline, IHG reported Q4 2026 forward booking pace ramping up, led by GCC domestic travellers and Indian visitors, with demand redistributing toward Egypt and Saudi Arabia rather than disappearing. IHG operates 39 hotels in the UAE and 48 in Saudi Arabia, with roughly 27 MENA openings planned through 2027.
The transferable lesson: forward pace by source market is the leading indicator. Actuals are a lagging one. Groups that watch pace pivoted their media two quarters before groups that watched occupancy.
A note from my own work
Across performance marketing engagements in the UAE and Saudi Arabia, including hotel and hospitality lead generation and travel-sector growth for an eSIM platform serving inbound and outbound GCC travellers: the pattern I have seen repeat is consistent with everything above. The accounts that survive a demand contraction are the ones where a meaningful share of revenue comes from audiences the business owns: email lists, app installs, loyalty members, retargeting pools built on first-party data. When paid acquisition costs spike or demand softens, owned audiences are the only thing that does not reprice against you. On one ecommerce engagement, the combination of first-party audience building and rigorous funnel optimisation took a brand from zero to USD 100k in monthly gross sales while cutting app-install CPA by roughly 60%: the same mechanic, applied in a different vertical.
11. Mistakes to Avoid
- Cutting marketing budget proportionally to occupancy. You are cutting the only function that can move demand.
- Discounting headline rate instead of adding value. ADR erosion outlasts the crisis by years and contaminates rate parity across every OTA.
- Waiting for demand to return before fixing the funnel. You will capture the recovery on OTA terms.
- Running English-only campaigns in Arabic-majority demand pools.
- Ignoring brand-term defence while OTAs bid on your hotel name and bill you commission for it.
- Treating the guest database as a CRM afterthought rather than the asset that determines next year’s acquisition cost.
- Card-only checkout. No Tabby, Tamara, mada, Benefit or Apple Pay means silent conversion loss on domestic traffic.
- Reporting occupancy without acquisition cost. Full hotels can lose money.
- Burst campaigns against a 15–25 day booking window.
- Deprioritising MICE re-engagement because it is slow. Slow is exactly why you start now.
12. What Changes in 2027
- Supply pressure arrives. Roughly 5,400 Dubai rooms return to the market through late 2026 and 2027, and Saudi Arabia’s pipeline: licensed hospitality facilities already grew 22.7% year on year to 6,122 in Q1 2026, adds further occupancy pressure. Recovering demand will meet expanding supply. Channel efficiency stops being optional.
- AI-assisted travel planning becomes a real discovery channel. Structured data, accurate rate feeds, review velocity and entity clarity determine whether an AI assistant recommends your property. This is SEO’s next frontier and it favours hotels with clean, well-marked-up direct websites over OTA listings.
- Rate parity enforcement continues to loosen in several markets, widening the room for genuine direct-booking price advantage.
- First-party data becomes the primary competitive moat as signal loss continues to degrade third-party targeting.
- Regional demand permanently rebalances. The 2026 shock taught every GCC operator what over-indexing on international discretionary demand costs. The hotels that restructure now will hold that advantage through the next cycle.
Key Takeaways
- UAE hotel occupancy fell 27.7 percentage points year on year through June 2026, with RevPAR down 31.8% (CBRE/CoStar). Dubai fell from 84.7% occupancy in February to around 33% in March.
- Demand redistributed, it did not disappear. Makkah grew RevPAR +4.7% while Riyadh lost 18.3%. Saudi domestic travel accounted for roughly 78% of Q1 2026 arrivals.
- S&P expects recovery to begin in Q4 2026, with pre-conflict levels unlikely before end-2027. Airlift is returning faster than confidence: making this a demand-generation problem.
- Run the demand pools analysis on your own reservations. Most GCC hotels find 55–70% of room nights sit in the single most shock-sensitive, highest-cost pool.
- Channel mix is the only RevPAR lever fully within your control. Shifting 15 points from OTA to direct on a 200-room Dubai hotel is worth roughly AED 434,000 a year, with zero additional bookings.
- A 7-point reduction in blended acquisition cost delivers an 8.7% Net RevPAR improvement: without buying a single extra guest.
- Build the direct engine before Q4 demand returns, not during it.
Frequently Asked Questions
Why are hotel bookings down in Dubai in 2026?
Regional geopolitical disruption through the first half of 2026 affected international travel demand and airline operations across the Gulf. CBRE, using CoStar data, reported UAE occupancy down 27.7 percentage points year on year through June, with RevPAR down 31.8%. Dubai International handled 18.6 million passengers in Q1 2026, down 20.6% year on year. The decline is concentrated in international discretionary leisure and MICE demand rather than domestic or purpose-driven travel.
When will Dubai and GCC hotel occupancy recover?
S&P Global Ratings expects occupancy to begin improving from the fourth quarter of 2026, but does not expect a return to pre-conflict levels before the end of 2027. Leading indicators have already turned: GCC passenger volumes rose 66.2% between April and May 2026, and airlines were scheduled to operate around 22.9 million departing seats from and within the Middle East in July.
How can a hotel increase occupancy without cutting rates?
Shift demand pools rather than cutting price. Target domestic residents, intra-GCC family travel, purpose-driven segments and near-haul markets such as India, and respond to a confidence-driven shortfall with value-add packaging (resort credits, F&B inclusions, flexible cancellation), rather than headline rate reductions. Rate cuts address a price objection; they do not address uncertainty.
How much commission do OTAs charge hotels in the GCC?
Standard programmes typically run 15–22% commission, with a true cost of 25–35% once upsell commission, higher cancellation rates, technology fees and tax treatment are included. Preferred and visibility programmes push commission to 20–28%, with true costs of 30–42%. Booking.com typically sits around 15% (ranging 10–25%), and Expedia Group generally 18–22%.
What does a direct booking actually cost a hotel?
Direct organic and brand-search bookings cost roughly 2–5% of booking value. Email and CRM to past guests costs 2–4%. Metasearch runs 8–14%, and non-brand paid search 10–18%. A blended direct programme typically lands between 5% and 12%, versus 25–35% true cost on OTAs.
What is a good hotel website conversion rate in 2026?
The average sits between 2.2% and 3.9%. High-performing boutique properties exceed 5%. Unoptimised sites can be as low as 0.73%. Because OTA visitors arrive with high purchase intent, OTA conversion rates of 12–15% are context rather than a benchmark to chase.
Should hotels leave OTAs entirely?
No. OTAs deliver reach and demand that most independent properties cannot generate alone, and there is a genuine billboard effect: a meaningful share of travellers who begin a search on an OTA go on to book direct. The objective is not zero OTA. It is to move the bookings that should be direct (repeat guests, brand searches, loyalty members and domestic residents) off the commission line.
How long does it take to see results from a direct booking strategy?
Brand-term defence and metasearch activation typically show measurable channel shift within 30–60 days. Booking engine CRO improvements show within one full booking cycle. CRM and first-party database value compounds over 6–18 months. The 90-day playbook in this article is designed to have the infrastructure operational before Q4 2026 demand returns.
What should a GCC hotel’s direct booking share be?
It varies by segment and brand affiliation, but a resilient independent or soft-branded property in this region should be targeting 30–40% direct as a floor, with a clear pathway above that through loyalty and CRM. Below 20% direct means your entire demand base is rented.
Is Saudi Arabia a better hospitality market than the UAE right now?
They are different, not better or worse. Saudi Arabia’s religious tourism base provided real insulation (Makkah grew RevPAR while Riyadh declined sharply), but a large incoming supply pipeline will pressure occupancy over the coming years. The UAE has deeper international connectivity and a stronger events and MICE infrastructure to drive recovery. The strategic answer for most operators is exposure to both, with demand-pool diversification within each.
Conclusion
The GCC hotel market did not lose its demand in 2026. It lost the cheapest, laziest version of its demand: the international discretionary traveller who arrived through an OTA at 25–35% true cost and left no first-party record behind.
That guest will come back. S&P says the recovery starts in Q4 2026 and completes some time in 2027. Airlift is already returning. The question is not whether your occupancy recovers. It is what your occupancy costs you when it does.
Hotels that spend the next ninety days rebalancing demand pools, defending brand terms, activating metasearch, fixing the booking funnel and building a consented first-party database will capture the recovery at 8–14% acquisition cost. Hotels that wait will capture the same recovery at 25–35%, and arrive in 2027, facing returning supply, with exactly the same structural vulnerability they had in February 2026.
The market has handed you an unusual gift: a window where demand is soft enough that fixing distribution is a board-level priority, and long enough to actually do it. That window closes in Q4.
Work With Me
If you are a hotel owner, hospitality group, tourism operator or marketing director in the UAE, Saudi Arabia, Qatar, Bahrain, Kuwait or Oman and the numbers in this article describe your P&L, this is exactly the work I do.
I bring over a decade of hands-on performance marketing, ecommerce and growth leadership across the GCC, running Google Ads, Meta, TikTok, Snapchat and LinkedIn at scale, building SEO and ASO programmes, leading regional in-house teams, and rebuilding acquisition economics for brands across hospitality, travel, real estate, ecommerce and fintech in the UAE, Saudi Arabia and Bahrain. Not theory. Accounts I have personally structured, budgets I have personally owned, and P&Ls I have personally moved. You can read more about my background here.
I can help with:
- Demand pool and channel mix audits
- Direct booking strategy and OTA dependency reduction
- Google Ads, Meta, TikTok and metasearch management
- Hotel and hospitality SEO (English and Arabic)
- Booking engine conversion rate optimisation
- CRM, lifecycle marketing and first-party data strategy
- Marketing analytics, GA4 and attribution setup
- Performance marketing audits and growth consulting
- AI marketing and marketing automation
- Full marketing strategy and digital transformation
Email me: salmangul@hotmail.com
If you are looking for someone with both the strategic and executional capability described in this article, get in touch directly.
Tell me your current occupancy, your direct share and your blended acquisition cost, and I will tell you within one conversation where the recoverable revenue is.